Text to Image
Infographic Explaining Fibonacci Sequence with Math and Code — AI Image Prompt
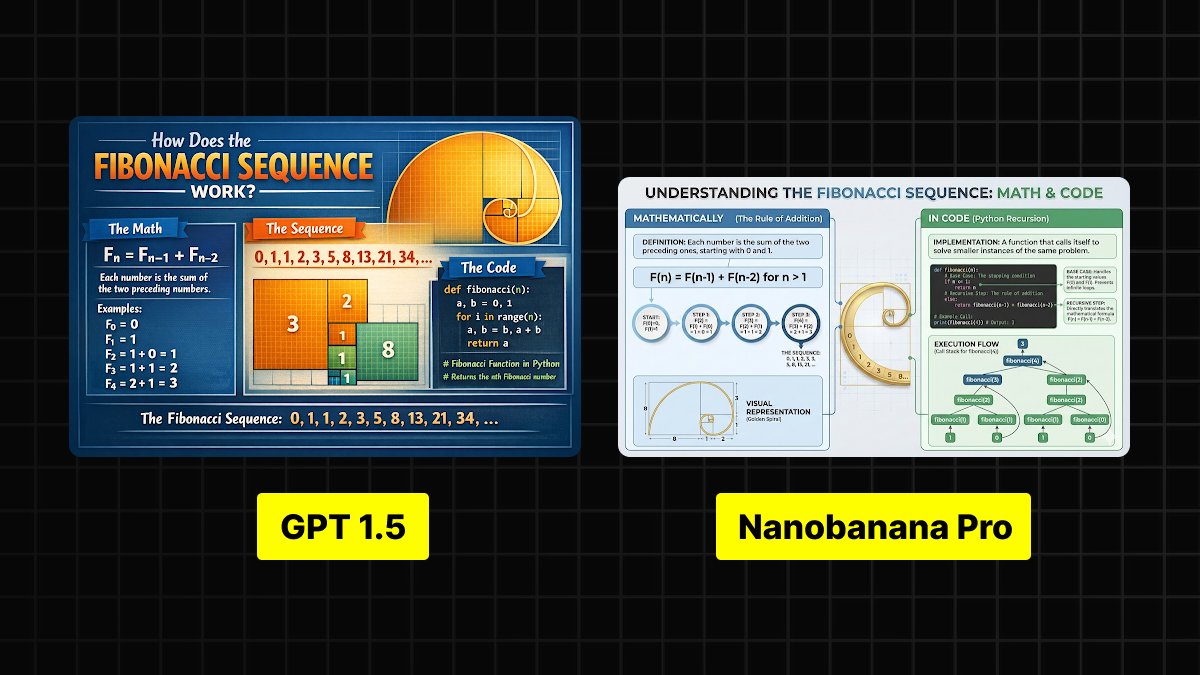
A prompt designed to generate a complex infographic that explains the Fibonacci sequence, requiring the visual representation to incorporate both mathematical concepts and coding examples, aiming for a clean layout and clear visual hierarchy. - AIPinMaker
Prompt
Create a cinematic image of Infographic Explaining Fibonacci Sequence With Math And Code. Style: photorealistic. Composition: balanced and well-framed. Lighting: natural with cinematic mood. Category: cinematic-video. Reference: infographic-explaining-fibonacci-sequence-with-math-and-code-1867.
Prompt breakdown
- Subject
- Infographic explaining Fibonacci Sequence with math and code
- Style
- photorealistic cinematic
- Lighting
- natural with cinematic mood
- Composition
- balanced and well-framed
- Mood
- cinematic
Remix ideas
- Replace the code block with a JavaScript recursive example to target web developers
- Overlay faint golden-ratio spirals that echo the sequence numbers
- Change background texture to aged parchment while keeping photorealistic rendering
How to use this AI Image prompt template
 1
1Copy the prompt — grab this template’s prompt and negative prompt.  2
2Pick a model — choose a recommended AI model for the best match.  3
3Generate — open the studio with one click and create your result.
Related templates

Premium Pitch Deck Storyboard
Create a game image of Premium Pitch Deck Storyboard. Style: photorealistic. Composition: balanced and well-framed. Lighting: natural with cinematic mood. Category: illustration. Reference: premium-pitch-deck-storyboard-25540.

Dense vs MoE Neural Network Infographic
{ "type": "infographic comparison diagram", "header": { "title": "{argument name=\"main title\" default=\"Dense と MoE の違い\"}" }, "layout": { "structure": "two main columns separated by a central VS badge, with a split footer at the bottom", "sections": [ { "position": "left column", "theme_color": "blue", "header": "{argument name=\"left model name\" default=\"Dense モデル\"}", "subtitle": "全てのニューロンが活性化", "diagram": { "type": "fully connected neural network", "elements": [ "1 orange input node labeled 入力", "4 hidden layers with 4, 5, 4, and 2 nodes respectively", "nodes colored white, blue, and yellow", "dense intersecting connection lines between all adjacent nodes" ] }, "bullet_points": { "count": 2, "items": [ "{argument name=\"left bullet point\" default=\"全てのパラメータが使用\"}", "計算コストが高い" ] } }, { "position": "right column", "theme_color": "orange", "header": "{argument name=\"right model name\" default=\"MoE モデル\"}", "subtitle": "一部の専門家が選択的に活性化", "diagram": { "type": "mixture of experts network", "elements": [ "1 orange input node labeled 入力", "3 rectangular blocks labeled Expert 1, Expert 2, Expert 3", "1 yellow output node labeled 出力", "branching arrows connecting input to experts, and experts to output" ] }, "bullet_points": { "count": 2, "items": [ "{argument name=\"right bullet point\" default=\"一部のエキスパートのみ使用\"}", "効率的でスケーラブル" ] } }, { "position": "center", "element": "red circular badge with text VS", "connections": "blue arrow pointing left, orange arrow pointing right" }, { "position": "footer left", "background": "light blue", "text": "Dense: すべての層が常時稼働し全パラメータを使用", "icon": "1 CPU chip graphic", "label": "高い消費電力" }, { "position": "footer right", "background": "light orange", "text": "MoE: 必要なエキスパートのみを動員", "icons": "2 circular graphics (orange arrows, blue lightning bolt)", "label": "低コスト・高効率" } ] } }3b:Ta7a,{ "type": "infographic comparison diagram", "header": { "title": "{argument name=\"main title\" default=\"Dense と MoE の違い\"}" }, "layout": { "structure": "two main columns separated by a central VS badge, with a split footer at the bottom",

Encyclopedia Style Infographic Generator
Create a infographic image of Encyclopedia Style Infographic Generator. Style: photorealistic. Composition: balanced and well-framed. Lighting: natural with cinematic mood. Category: illustration. Reference: encyclopedia-style-infographic-generator-14129.

Infographic Creation with Simple Text Prompt
Create a infographic image of Infographic Creation With Simple Text Prompt. Style: photorealistic. Composition: balanced and well-framed. Lighting: natural with cinematic mood. Category: illustration. Reference: infographic-creation-with-simple-text-prompt-11083.

Dopamine and schizophrenia synapse diagram
Create a creative image of Dopamine And Schizophrenia Synapse Diagram. Style: photorealistic. Composition: balanced and well-framed. Lighting: natural with cinematic mood. Category: photography. Reference: dopamine-and-schizophrenia-synapse-diagram-255.

Infographic about the Jackson Laboratory
Create a infographic image of Infographic About The Jackson Laboratory. Style: photorealistic. Composition: balanced and well-framed. Lighting: natural with cinematic mood. Category: illustration. Reference: infographic-about-the-jackson-laboratory-460.
Explore more prompts
Browse more AI image and video prompts by category.
FAQ
- Which Fibonacci elements are shown in both math and code form?
- The infographic displays the standard recurrence relation alongside a matching code implementation, typically Python, for direct comparison.
- Why does the cinematic treatment matter for this math topic?
- Natural lighting and balanced framing make the dense formulas and syntax feel approachable, mimicking a high-end educational film still rather than a flat diagram.