Text to Image
Scientific Process Infographic — AI Image Prompt
Generates a 3-step educational infographic explaining a scientific concept with visual metaphors and explanatory text. - AIPinMaker
Prompt
{
"type": "educational infographic",
"style": "clean, modern, scientific illustration",
"background": "dark blue gradient",
"header": {
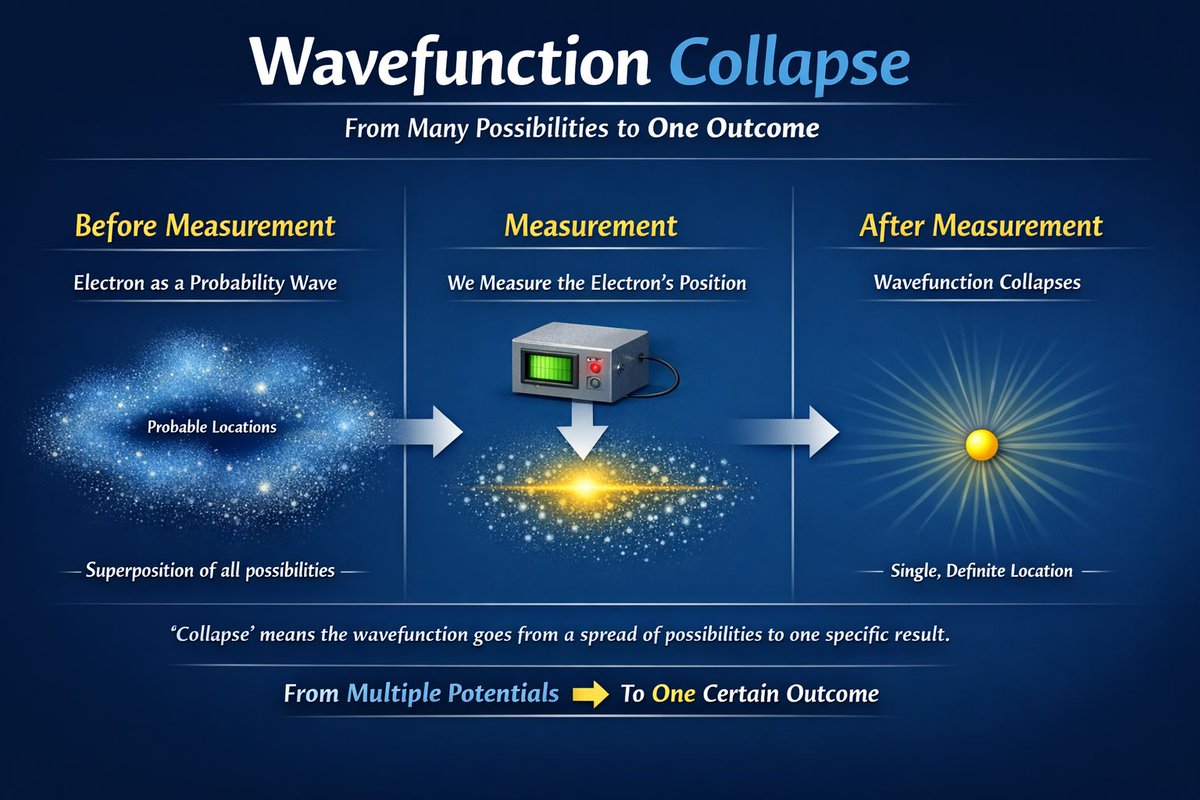
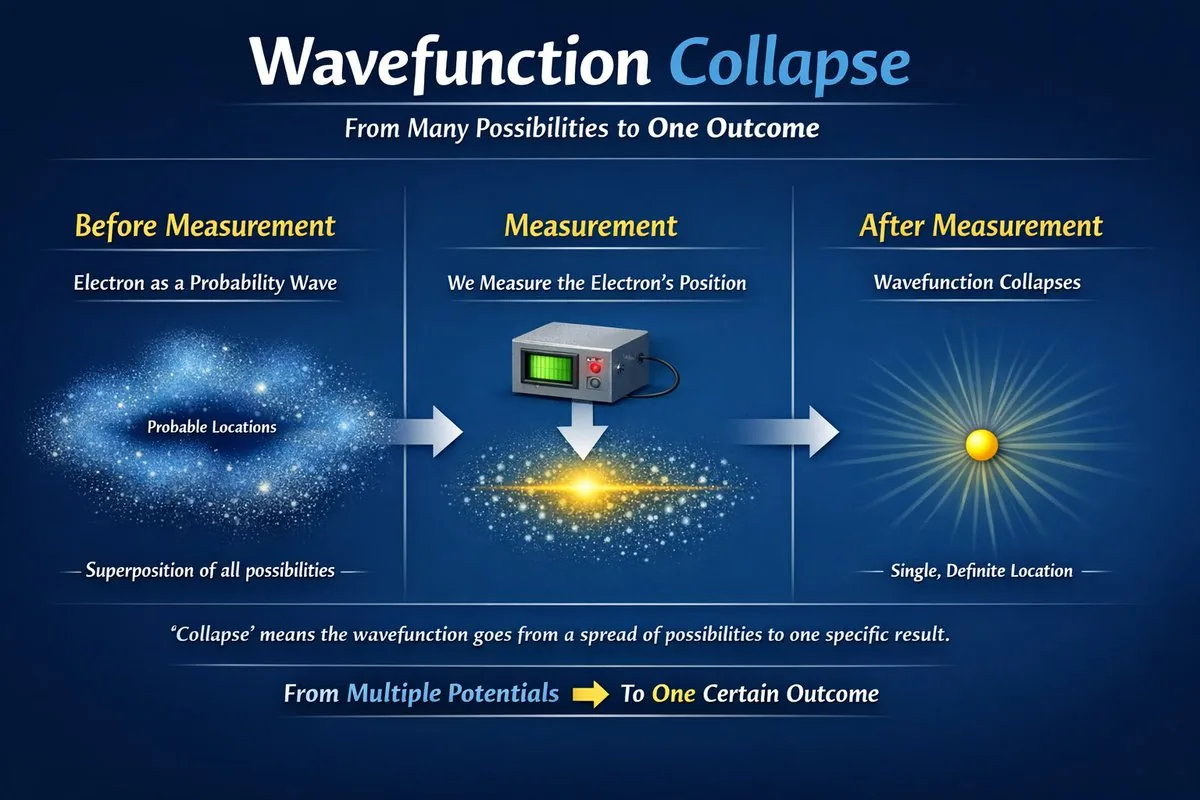
"title": "{argument name=\"main title\" default=\"Wavefunction Collapse\"}",
"subtitle": "From Many Possibilities to One Outcome"
},
"layout": {
"structure": "3 columns separated by thin vertical lines, connected by 2 horizontal right-pointing arrows",
"sections": [
{
"heading": "{argument name=\"step 1 title\" default=\"Before Measurement\"}",
"subheading": "{argument name=\"subject\" default=\"Electron\"} as a Probability Wave",
"visual": "diffuse, glowing blue cloud of particles resembling a nebula",
"labels": ["Probable Locations", "Superposition of all possibilities"]
},
{
"heading": "{argument name=\"step 2 title\" default=\"Measurement\"}",
"subheading": "We Measure the {argument name=\"subject\" default=\"Electron\"}'s Position",
"visual": "grey rectangular measuring device with a green screen and red button, with a downward arrow pointing to a flattened, glowing blue and yellow particle cloud"
},
{
"heading": "{argument name=\"step 3 title\" default=\"After Measurement\"}",
"subheading": "Wavefunction Collapses",
"visual": "single, solid yellow sphere emitting radial light rays",
"labels": ["Single, Definite Location"]
}
]
},
"footer": {
"explanation": "'Collapse' means the wavefunction goes from a spread of possibilities to one specific result.",
"summary": "From Multiple Potentials [yellow right arrow] To One Certain Outcome"
}
}Prompt breakdown
- Subject
- Electron wavefunction collapse from diffuse blue probability nebula through measurement device to single yellow sphere
- Style
- clean, modern, scientific illustration
- Lighting
- glowing blue particle cloud, flattened blue-yellow cloud, and radial light rays from yellow sphere on dark blue gradient
- Composition
- three columns separated by thin vertical lines and linked by two horizontal right-pointing arrows
- Mood
- educational and precise, tracing quantum measurement stages
Remix ideas
- replace electron with photon and adjust first visual to a light wave pattern
- swap the measurement device to a circular detector for variety in apparatus style
- add faint ψ(x) probability equations beside the initial nebula labels
Reference images
How to use this AI Image prompt template
 1
1Copy the prompt — grab this template’s prompt and negative prompt.  2
2Pick a model — choose a recommended AI model for the best match.  3
3Generate — open the studio with one click and create your result.
Related templates

Infographic Explaining Fibonacci Sequence with Math and Code
Create a cinematic image of Infographic Explaining Fibonacci Sequence With Math And Code. Style: photorealistic. Composition: balanced and well-framed. Lighting: natural with cinematic mood. Category: cinematic-video. Reference: infographic-explaining-fibonacci-sequence-with-math-and-code-1867.

Premium Pitch Deck Storyboard
Create a game image of Premium Pitch Deck Storyboard. Style: photorealistic. Composition: balanced and well-framed. Lighting: natural with cinematic mood. Category: illustration. Reference: premium-pitch-deck-storyboard-25540.

Dense vs MoE Neural Network Infographic
{ "type": "infographic comparison diagram", "header": { "title": "{argument name=\"main title\" default=\"Dense と MoE の違い\"}" }, "layout": { "structure": "two main columns separated by a central VS badge, with a split footer at the bottom", "sections": [ { "position": "left column", "theme_color": "blue", "header": "{argument name=\"left model name\" default=\"Dense モデル\"}", "subtitle": "全てのニューロンが活性化", "diagram": { "type": "fully connected neural network", "elements": [ "1 orange input node labeled 入力", "4 hidden layers with 4, 5, 4, and 2 nodes respectively", "nodes colored white, blue, and yellow", "dense intersecting connection lines between all adjacent nodes" ] }, "bullet_points": { "count": 2, "items": [ "{argument name=\"left bullet point\" default=\"全てのパラメータが使用\"}", "計算コストが高い" ] } }, { "position": "right column", "theme_color": "orange", "header": "{argument name=\"right model name\" default=\"MoE モデル\"}", "subtitle": "一部の専門家が選択的に活性化", "diagram": { "type": "mixture of experts network", "elements": [ "1 orange input node labeled 入力", "3 rectangular blocks labeled Expert 1, Expert 2, Expert 3", "1 yellow output node labeled 出力", "branching arrows connecting input to experts, and experts to output" ] }, "bullet_points": { "count": 2, "items": [ "{argument name=\"right bullet point\" default=\"一部のエキスパートのみ使用\"}", "効率的でスケーラブル" ] } }, { "position": "center", "element": "red circular badge with text VS", "connections": "blue arrow pointing left, orange arrow pointing right" }, { "position": "footer left", "background": "light blue", "text": "Dense: すべての層が常時稼働し全パラメータを使用", "icon": "1 CPU chip graphic", "label": "高い消費電力" }, { "position": "footer right", "background": "light orange", "text": "MoE: 必要なエキスパートのみを動員", "icons": "2 circular graphics (orange arrows, blue lightning bolt)", "label": "低コスト・高効率" } ] } }3b:Ta7a,{ "type": "infographic comparison diagram", "header": { "title": "{argument name=\"main title\" default=\"Dense と MoE の違い\"}" }, "layout": { "structure": "two main columns separated by a central VS badge, with a split footer at the bottom",

Encyclopedia Style Infographic Generator
Create a infographic image of Encyclopedia Style Infographic Generator. Style: photorealistic. Composition: balanced and well-framed. Lighting: natural with cinematic mood. Category: illustration. Reference: encyclopedia-style-infographic-generator-14129.

Infographic Creation with Simple Text Prompt
Create a infographic image of Infographic Creation With Simple Text Prompt. Style: photorealistic. Composition: balanced and well-framed. Lighting: natural with cinematic mood. Category: illustration. Reference: infographic-creation-with-simple-text-prompt-11083.

Dopamine and schizophrenia synapse diagram
Create a creative image of Dopamine And Schizophrenia Synapse Diagram. Style: photorealistic. Composition: balanced and well-framed. Lighting: natural with cinematic mood. Category: photography. Reference: dopamine-and-schizophrenia-synapse-diagram-255.
Explore more prompts
Browse more AI image and video prompts by category.
FAQ
- What does the flattened glowing cloud in the measurement panel represent?
- It depicts the electron's probability distribution being reduced as the grey device with green screen takes a position reading.
- Why does the final visual use a solid yellow sphere with light rays?
- The sphere illustrates the post-collapse single definite location, contrasting the earlier spread-out blue nebula of possibilities.