Text to Image
Medical Infographic JSON Prompt — AI Image Prompt
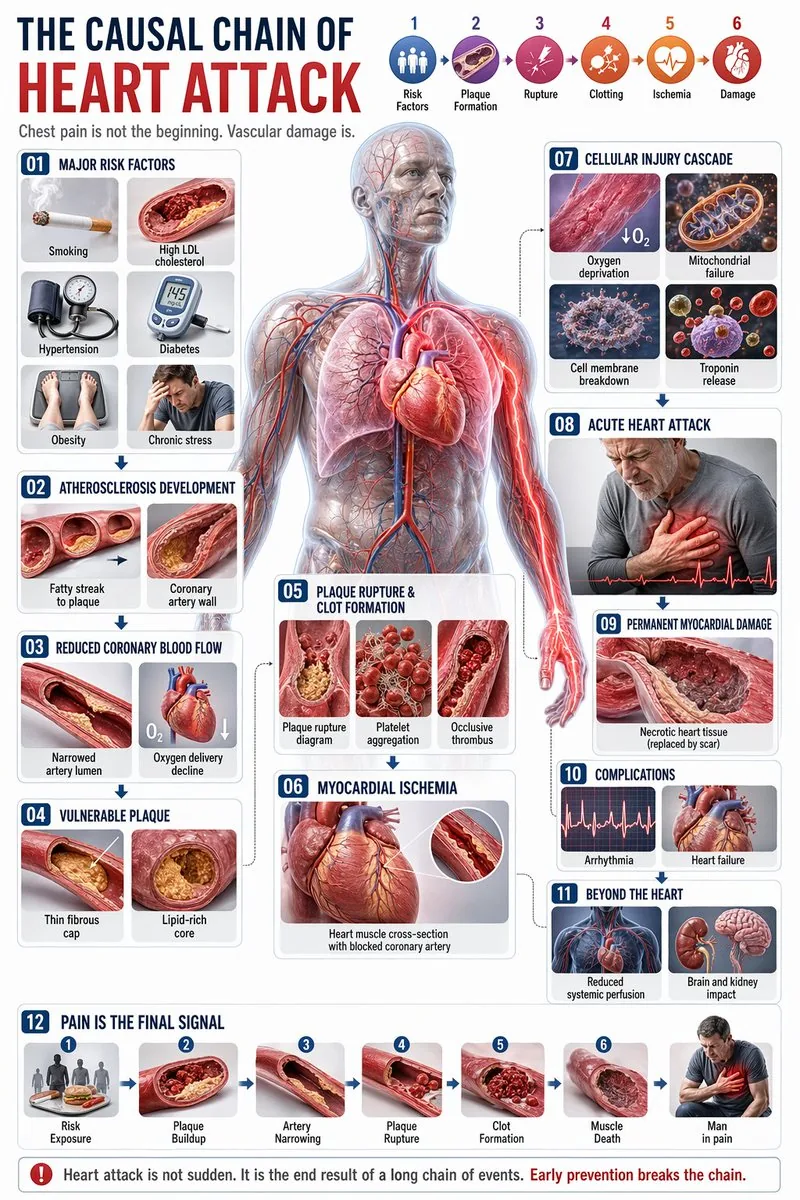
A complex structured JSON prompt for generating a professional 3D medical infographic about heart attacks. - AIPinMaker

Prompt
{
  "type": "comprehensive medical infographic",
  "style": "highly detailed 3D medical illustration, clinical white background, clean typography",
  "header": {
    "title_cn": "",
    "title_en": "{argument name=\"english title\" default=\"THE CAUSAL CHAIN OF HEART ATTACK\"}",
    "subtitle": "Chest pain is not the beginning. Vascular damage is.",
    "top_right_sequence": {
      "count": 6,
      "labels": [
        "Risk Factors",
        "Plaque Formation",
        "Rupture",
        "Clotting",
        "Ischemia",
        "Damage"
      ]
    }
  },
  "centerpiece": {
    "description": "{argument name=\"central figure\" default=\"transparent anatomical human body showing heart, coronary arteries, lungs, and vascular system\"}",
    "details": "pathway highlighted in {argument name=\"highlight color\" default=\"glowing red\"} focusing on the coronary arteries and radiating pain to the chest and left arm"
  },
  "layout": {
    "left_column": [
      {
        "id": "01",
        "title": "Major Risk Factors",
        "elements": 6,
        "labels": [
          "Smoking",
          "High LDL cholesterol",
          "Hypertension",
          "Diabetes",
          "Obesity",
          "Chronic stress"
        ]
      },
      {
        "id": "02",
        "title": "Atherosclerosis Development",
        "elements": 2,
        "labels": [
          "Fatty streak to plaque",
          "Coronary artery wall"
        ]
      },
      {
        "id": "03",
        "title": "Reduced Coronary Blood Flow",
        "elements": 2,
        "labels": [
          "Narrowed artery lumen",
          "Oxygen delivery decline"
        ]
      },
      {
        "id": "04",
        "title": "Vulnerable Plaque",
        "elements": 2,
        "labels": [
          "Thin fibrous cap",
          "Lipid-rich core"
        ]
      }
    ],
    "center_overlay": [
      {
        "id": "05",
        "title": "Plaque Rupture & Clot Formation",
        "elements": 3,
        "labels": [
          "Plaque rupture diagram",
          "Platelet aggregation",
          "Occlusive thrombus"
        ]
      },
      {
        "id": "06",
        "title": "Myocardial Ischemia",
        "elements": 1,
        "labels": [
          "Heart muscle cross-section with blocked coronary artery"
        ]
      }
    ],
    "right_column": [
      {
        "id": "07",
        "title": "Cellular Injury Cascade",
        "elements": 4,
        "labels": [
          "Oxygen deprivation",
          "Mitochondrial failure",
          "Cell membrane breakdown",
          "Troponin release"
        ]
      },
      {
        "id": "08",
        "title": "Acute Heart Attack",
        "elements": 1,
        "labels": [
          "Patient clutching chest"
        ]
      },
      {
        "id": "09",
        "title": "Permanent Myocardial Damage",
        "elements": 1,
        "labels": [
          "Necrotic heart tissue"
        ]
      },
      {
        "id": "10",
        "title": "Complications",
        "elements": 2,
        "labels": [
          "Arrhythmia",
          "Heart failure"
        ]
      },
      {
        "id": "11",
        "title": "Beyond the Heart",
        "elements": 2,
        "labels": [
          "Reduced systemic perfusion",
          "Brain and kidney impact"
        ]
      }
    ],
    "bottom_row": [
      {
        "id": "12",
        "title": "Pain Is the Final Signal",
        "elements": 7,
        "labels": [
          "Risk Exposure",
          "Plaque Buildup",
          "Artery Narrowing",
          "Plaque Rupture",
          "Clot Formation",
          "Muscle Death",
          "Man in pain"
        ]
      }
    ]
  },
  "theme": "{argument name=\"disease focus\" default=\"heart attack and coronary artery blockage\"}"
}Prompt breakdown
- Subject
- comprehensive medical infographic on the causal chain of heart attack with transparent anatomical body, coronary arteries, and 12 labeled stages from risk factors to permanent damage
- Style
- highly detailed 3D medical illustration, clinical white background, clean typography
- Composition
- left column panels on risk factors and atherosclerosis, center overlays on plaque rupture and ischemia, right column on cellular injury and complications, bottom timeline sequence
- Mood
- clinical and informative
Remix ideas
- swap glowing red highlight for deep purple to shift focus onto troponin release and cell membrane breakdown stages
- add a small ECG waveform overlay next to the myocardial ischemia panel for added diagnostic context
- change the bottom timeline to a vertical flow on the right edge while keeping all 12 panel labels intact
Reference images
How to use this AI Image prompt template
 1
1Copy the prompt — grab this template’s prompt and negative prompt.  2
2Pick a model — choose a recommended AI model for the best match.  3
3Generate — open the studio with one click and create your result.
Related templates

Technical Breakdown Infographic
Create a infographic image of Technical Breakdown Infographic. Style: photorealistic. Composition: balanced and well-framed. Lighting: natural with cinematic mood. Category: illustration. Reference: technical-breakdown-infographic-24451.

Infographic Explaining Fibonacci Sequence with Math and Code
Create a cinematic image of Infographic Explaining Fibonacci Sequence With Math And Code. Style: photorealistic. Composition: balanced and well-framed. Lighting: natural with cinematic mood. Category: cinematic-video. Reference: infographic-explaining-fibonacci-sequence-with-math-and-code-1867.

Premium Pitch Deck Storyboard
Create a game image of Premium Pitch Deck Storyboard. Style: photorealistic. Composition: balanced and well-framed. Lighting: natural with cinematic mood. Category: illustration. Reference: premium-pitch-deck-storyboard-25540.

Exploded View Invention Infographic
2x2 grid, do this for tesla coil (invention) and 3 other famous inventions. 16:9 inventor_content = ( patent_drawing_recreation_in_isometric_exploded_view_of_[invention (invention placeholder)]_by_[inventor (inventor placeholder)] * 1.7 ) + ( historical_context_timeline_of_scientific_breakthroughs_leading_to_[invention] * 1.5 ) + ( failure_log_and_iteration_cards_showing_[inventor]_s_failed_prototypes_with_annotations * 1.6 ) + ( cross_section_and_mechanics_diagram_of_[invention]_with_material_callouts * 1.4 ) + ( economic_and_cultural_impact_ripple_map_of_[invention]_on_society * 1.3 ) + ( quirky_personal_habit_or_workshop_inserts_from_[inventor]_s_biography * 1.2 ) + ( modern_day_derivative_technologies_tree_from_[invention] * 1.1 ) + ( common_misconception_busting_panel_about_who_really_invented_[invention] * 1.0 ) - ( romanticized_lone_genius_cliché_without_team_context / 3.0 ) - ( boring_textbook_engraving_style_instead_of_dynamic_infographic / 2.9 ) - ( eurocentric_filter_if_invention_originated_elsewhere / 3.2 )3

3D Cutaway Volcano Diagram
A 3D cutaway diagram of a volcano, showing its internal structure. The diagram should clearly label the magma chamber, conduit, throat, crater, and layers of ash and lava. The style should be a clean, technical illustration, with realistic textures for the rock and magma. This demonstrates the ability to generate accurate, science-based visuals for educational purposes, requiring strong spatial and scientific reasoning. –ar 16:9

Dense vs MoE Neural Network Infographic
{ "type": "infographic comparison diagram", "header": { "title": "{argument name=\"main title\" default=\"Dense と MoE の違い\"}" }, "layout": { "structure": "two main columns separated by a central VS badge, with a split footer at the bottom", "sections": [ { "position": "left column", "theme_color": "blue", "header": "{argument name=\"left model name\" default=\"Dense モデル\"}", "subtitle": "全てのニューロンが活性化", "diagram": { "type": "fully connected neural network", "elements": [ "1 orange input node labeled 入力", "4 hidden layers with 4, 5, 4, and 2 nodes respectively", "nodes colored white, blue, and yellow", "dense intersecting connection lines between all adjacent nodes" ] }, "bullet_points": { "count": 2, "items": [ "{argument name=\"left bullet point\" default=\"全てのパラメータが使用\"}", "計算コストが高い" ] } }, { "position": "right column", "theme_color": "orange", "header": "{argument name=\"right model name\" default=\"MoE モデル\"}", "subtitle": "一部の専門家が選択的に活性化", "diagram": { "type": "mixture of experts network", "elements": [ "1 orange input node labeled 入力", "3 rectangular blocks labeled Expert 1, Expert 2, Expert 3", "1 yellow output node labeled 出力", "branching arrows connecting input to experts, and experts to output" ] }, "bullet_points": { "count": 2, "items": [ "{argument name=\"right bullet point\" default=\"一部のエキスパートのみ使用\"}", "効率的でスケーラブル" ] } }, { "position": "center", "element": "red circular badge with text VS", "connections": "blue arrow pointing left, orange arrow pointing right" }, { "position": "footer left", "background": "light blue", "text": "Dense: すべての層が常時稼働し全パラメータを使用", "icon": "1 CPU chip graphic", "label": "高い消費電力" }, { "position": "footer right", "background": "light orange", "text": "MoE: 必要なエキスパートのみを動員", "icons": "2 circular graphics (orange arrows, blue lightning bolt)", "label": "低コスト・高効率" } ] } }3b:Ta7a,{ "type": "infographic comparison diagram", "header": { "title": "{argument name=\"main title\" default=\"Dense と MoE の違い\"}" }, "layout": { "structure": "two main columns separated by a central VS badge, with a split footer at the bottom",
Explore more prompts
Browse more AI image and video prompts by category.
FAQ
- What specific labels appear in the bottom timeline row?
- The bottom row shows seven sequential elements: Risk Exposure, Plaque Buildup, Artery Narrowing, Plaque Rupture, Clot Formation, Muscle Death, and Man in pain.
- Which elements are grouped under Cellular Injury Cascade?
- That right-column panel lists oxygen deprivation, mitochondrial failure, cell membrane breakdown, and troponin release as the four-step progression.