Text to Image
Editorial Dual-Axis Data Infographic — AI Image Prompt
Generates a clean, newspaper-style dual-axis line chart with annotations and a callout box, ideal for comparing contrasting data trends. - AIPinMaker

Prompt
{
"type": "editorial infographic dual-axis line chart",
"style": "clean, newspaper-style, off-white background, highly legible typography",
"header": {
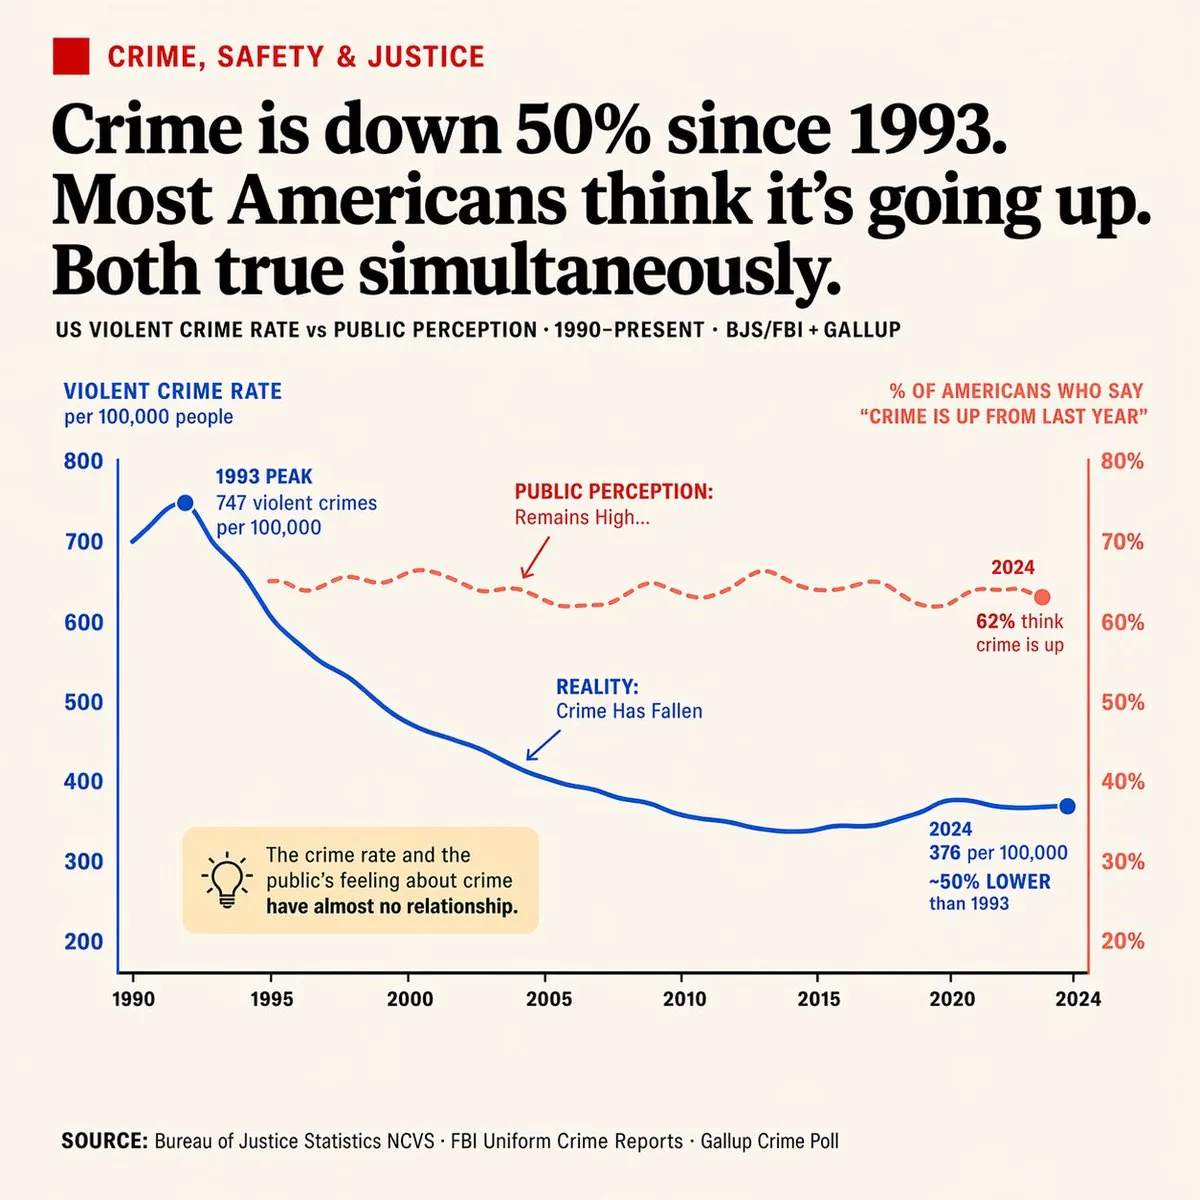
"category": "CRIME, SAFETY & JUSTICE (red text with red square icon)",
"headline": "{argument name=\"main headline\" default=\"Crime is down 50% since 1993. Most Americans think it's going up. Both true simultaneously.\"}",
"sub_headline": "US VIOLENT CRIME RATE vs PUBLIC PERCEPTION · 1990-PRESENT · BJS/FBI + GALLUP"
},
"chart": {
"x_axis": "Years 1990 to 2024 with 8 tick marks",
"left_y_axis": {
"color": "blue",
"label": "{argument name=\"left axis label\" default=\"VIOLENT CRIME RATE per 100,000 people\"}",
"range": "200 to 800"
},
"right_y_axis": {
"color": "red",
"label": "{argument name=\"right axis label\" default=\"% OF AMERICANS WHO SAY 'CRIME IS UP FROM LAST YEAR'\"}",
"range": "20% to 80%"
},
"data_series": [
{
"name": "Reality",
"style": "solid blue line",
"trend": "peaks early then drops significantly",
"annotations": [
"1993 PEAK 747 violent crimes per 100,000 (with blue dot)",
"REALITY: Crime Has Fallen (with blue arrow pointing to line)",
"2024 376 per 100,000 ~50% LOWER than 1993 (with blue dot)"
]
},
{
"name": "Public Perception",
"style": "dashed red line",
"trend": "remains relatively flat and high",
"annotations": [
"PUBLIC PERCEPTION: Remains High... (with red arrow pointing to line)",
"2024 62% think crime is up (with red dot)"
]
}
]
},
"callout_box": {
"position": "bottom left inside chart area",
"style": "light yellow rectangle",
"icon": "lightbulb",
"text": "{argument name=\"callout text\" default=\"The crime rate and the public's feeling about crime have almost no relationship.\"}"
},
"footer": {
"text": "SOURCE: {argument name=\"footer source\" default=\"Bureau of Justice Statistics NCVS · FBI Uniform Crime Reports · Gallup Crime Poll\"}"
}
}Prompt breakdown
- Subject
- dual-axis line chart comparing US violent crime rate per 100,000 from BJS/FBI against Gallup percentage saying crime is up, 1990-2024, with 1993 peak annotation and 2024 values
- Style
- clean newspaper-style infographic on off-white background with highly legible typography, red header text and square icon, solid blue and dashed red lines
- Composition
- left blue y-axis 200-800 for crime rate, right red y-axis 20-80% for perception, 8 x-axis ticks, bottom-left yellow callout box, source footer, and specific annotations with arrows and dots
- Mood
- factual and revealing, highlighting the statistical versus perceptual disconnect without sensationalism
Remix ideas
- Change the main headline to reference post-2020 crime upticks instead of the 1993-2024 drop
- Move the yellow callout box to top-right and update its text to cite a different statistic
- Swap the perception line to solid red while making the reality line thinner and dotted for visual contrast
Reference images
How to use this AI Image prompt template
 1
1Copy the prompt — grab this template’s prompt and negative prompt.  2
2Pick a model — choose a recommended AI model for the best match.  3
3Generate — open the studio with one click and create your result.
Related templates

Multilingual font specimen sheet prompt
Create a creative image of Multilingual Font Specimen Sheet Prompt. Style: photorealistic. Composition: balanced and well-framed. Lighting: natural with cinematic mood. Category: photography. Reference: multilingual-font-specimen-sheet-prompt-14142.

Fighting Game Blueprint Poster
Create a social-media image of Fighting Game Blueprint Poster. Style: photorealistic. Composition: balanced and well-framed. Lighting: natural with cinematic mood. Category: poster. Reference: fighting-game-blueprint-poster-21097.

Code Review English Infographic
{"type":"vertical Japanese educational infographic poster, fictional English learning material for programmers","style":"bright clean anime illustration, rounded blue borders, white background, teal and navy typography, pink accent marks, cute textbook layout, glossy vector icons, soft shadows, high readability, GPT-image-2 style","canvas":{"orientation":"portrait","aspect_ratio":"9:16","border":"thin rounded cyan outline with small sparkles, dots, speech bubbles and decorative emphasis lines"},"main_topic":{"headline":"{argument name=\"headline text\" default=\"コードレビューを依頼する\"}","subtitle":"品質向上やバグ予防のために使う表現","theme":"practical English phrases for asking someone to review code"},"main_phrase_section":{"position":"upper center","label":"メインフレーズ","english_phrase":"{argument name=\"main English phrase\" default=\"Can you review this code?\"}","japanese_translation":"このコードをレビューしてくれますか?","design":"large rounded speech-card with dashed divider line, big bold navy English text"},"related_phrases_section":{"position":"left middle","title":"関連フレーズ","count":4,"items":[{"icon":"blue open book","english":"Could you review this code for readability?","japanese":"読みやすさの観点でレビューしていただけますか?"},{"icon":"red bug","english":"Please check for potential bugs.","japanese":"潜在的なバグを確認してください。"},{"icon":"green speedometer","english":"Can you suggest a more efficient implementation?","japanese":"より効率的な実装を提案してくれますか?"},{"icon":"purple shield","english":"Could you check if this handles edge cases?","japanese":"エッジケースに対応できているか確認していただけますか?"}]},"character":{"description":"anime-style young woman programmer mascot seated at a desk, long vivid purple hair in a high side ponytail with loose bangs, face intentionally covered by a square blur/mosaic censor block, teal T-shirt reading AITuber, oversized pastel pink and blue jacket, typing on a gray laptop with a heart sticker, focused study mood","customization":{"name":"{argument name=\"character name\" default=\"Nike-chan\"}","hair_color":"{argument name=\"hair color\" default=\"deep purple\"}","shirt_text":"{argument name=\"shirt text\" default=\"AITuber\"}"}},"central_visuals":{"code_review_window":{"position":"center behind character","description":"dark code editor window showing a git diff with red removed line and green added line, small chat/comment icon in the top right"},"desk_objects":{"count":2,"items":["open gray laptop","white mug labeled AI with coffee"]}},"bottom_sections":{"chibi_character":{"position":"lower left","description":"small chibi version of the same purple-haired mascot sitting and pointing with a teacher pointer, face also covered by a square blur, tiny yellow letter A on hair accessory"},"review_points":{"position":"lower center","title":"レビュー観点の例","count":4,"items":[{"icon":"red bug","label":"バグ","checkmark":true},{"icon":"green speedometer","label":"効率性","checkmark":true},{"icon":"blue book","label":"読みやすさ","checkmark":true},{"icon":"purple shield","label":"セキュリティ / ベストプラクティス","checkmark":true}]},"vocabulary_memo":{"position":"lower right","title":"単語メモ","count":4,"items":[{"term":"readability","meaning":"読みやすさ"},{"term":"potential bugs","meaning":"起こりうるバグ"},{"term":"efficient","meaning":"効率的な"},{"term":"edge cases","meaning":"例外的なケース"}]},"tip_bar":{"position":"very bottom","label":"TIP","text":"レビューしてほしい観点を添えると、より実用的なフィードバックを得やすい。","icons":"lightbulb on the left and blue chat bubble on the right"}},"composition_notes":"Make every card rounded with cyan outlines; use crisp readable text; balance Japanese headline and English teaching phrases; include exactly 4 related phrase cards, exactly 4 review-point items, exactly 4 vocabulary entries, and exactly 2 desk objects. Maintain a cheerful learning-material look with sparkles and stickers."}

Minimalist Layout and Document Prompts
Create a creative image of Minimalist Layout And Document Prompts. Style: photorealistic. Composition: balanced and well-framed. Lighting: natural with cinematic mood. Category: photography. Reference: minimalist-layout-and-document-prompts-13704.

Five High-Efficiency Nano Banana Pro Prompts for Business Graphics
Create a creative image of Five High Efficiency Nano Banana Pro Prompts For Business Graphics. Style: photorealistic. Composition: balanced and well-framed. Lighting: natural with cinematic mood. Category: photography. Reference: five-high-efficiency-nano-banana-pro-prompts-for-business-graphics-1989.

Policy-style slide about national medical data strategy
Create a creative image of Policy Style Slide About National Medical Data Strategy. Style: photorealistic. Composition: balanced and well-framed. Lighting: natural with cinematic mood. Category: photography. Reference: policy-style-slide-about-national-medical-data-strategy-304.
Explore more prompts
Browse more AI image and video prompts by category.
FAQ
- Which exact data points are annotated on the blue reality line?
- The chart marks the 1993 peak at 747 violent crimes per 100,000 with a blue dot and the 2024 figure of 376 per 100,000 showing the ~50% decline.
- Why does the red perception line stay high and flat?
- Gallup poll responses on whether crime is up remain around 62% in 2024 despite the actual decline, illustrating the chart's core point about mismatched public feeling.