Text to Image
Complex Infographic Explainer Sheet — AI Image Prompt
Generates a highly detailed, multi-section infographic with charts, flowcharts, and vector illustrations. - AIPinMaker

Prompt
{
"type": "comprehensive infographic explainer sheet",
"style": "{argument name=\"illustration style\" default=\"flat vector anime style\"}",
"color_palette": "{argument name=\"color palette\" default=\"beige background with dark brown, red, and blue accents\"}",
"layout": {
"header": {
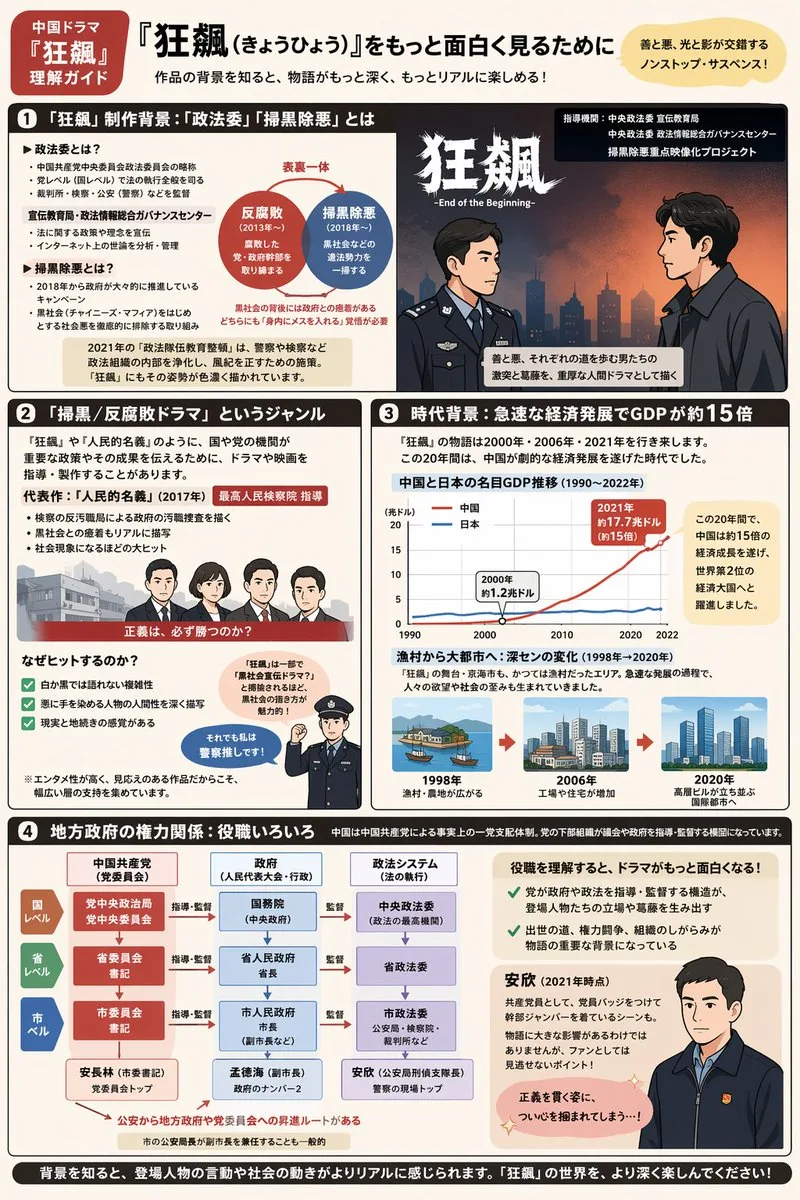
"tag": "中国ドラマ『狂飆』理解ガイド",
"main_title": "{argument name=\"main title\" default=\"『狂飆(きょうひょう)』をもっと面白く見るために\"}",
"subtitle": "作品の背景を知ると、物語がもっと深く、もっとリアルに楽しめる!",
"top_right_badge": "善と悪、光と影が交錯するノンストップ・サスペンス!"
},
"sections": [
{
"number": 1,
"title": "「狂飆」制作背景:「政法委」「掃黒除悪」とは",
"components": [
{"type": "bulleted text", "description": "Definitions of political terms"},
{"type": "diagram", "description": "2 overlapping circles labeled 反腐敗 and 掃黒除悪"},
{"type": "illustration", "description": "2 men facing each other in profile; 1 in a police uniform, 1 in a dark suit with a red tie"}
]
},
{
"number": 2,
"title": "「掃黒/反腐敗ドラマ」というジャンル",
"components": [
{"type": "illustration", "description": "Lineup of 4 characters (3 men, 1 woman) behind a red banner"},
{"type": "checklist", "count": 3, "description": "Reasons for the hit, with green checkmarks"},
{"type": "illustration", "description": "1 police officer pointing upwards with a speech bubble"}
]
},
{
"number": 3,
"title": "時代背景:急速な経済発展でGDPが約15倍",
"components": [
{"type": "chart", "chart_type": "{argument name=\"chart type\" default=\"line chart comparing two trends over time\"}", "description": "GDP comparison between China and Japan (1990-2022)"},
{"type": "timeline", "count": 3, "description": "City evolution showing 3 stages: 1998 village, 2006 factories, 2020 modern high-rise city"}
]
},
{
"number": 4,
"title": "地方政府の権力関係:役職いろいろ",
"components": [
{"type": "flowchart", "topic": "{argument name=\"flowchart topic\" default=\"Local government power structure\"}", "description": "3x3 grid showing National, Provincial, and City levels across Party, Government, and Legal systems"},
{"type": "illustration", "description": "1 man in a dark jacket looking forward, with text explaining his role"}
]
}
],
"footer": {
"text": "背景を知ると、登場人物の言動や社会の動きがよりリアルに感じられます。「狂飆」の世界を、より深く楽しんでください!"
}
}
}Prompt breakdown
- Subject
- Comprehensive infographic explainer sheet on 狂飆 covering production background of 政法委 and 掃黒除悪 with overlapping circles and two profile men, genre elements via four-character lineup behind red banner and three-item checklist, GDP line chart China-Japan 1990-2022 plus three-stage city timeline, and 3x3 government power grid flowchart with dark-jacketed man portrait
- Style
- Flat vector anime style on beige background with dark brown, red, and blue accents
- Composition
- Header with tag 中国ドラマ『狂飆』理解ガイド, main title 『狂飆(きょうひょう)』をもっと面白く見るために and top-right badge on 善と悪、光と影, four numbered sections mixing bulleted text, diagrams, illustrations, checklist, chart, timeline and flowchart, plus footer text on background knowledge enhancing realism
Remix ideas
- Swap the GDP line chart for a bar chart focused only on China's 15x growth spikes
- Replace the 3x3 grid with a vertical hierarchy flowchart emphasizing Legal system roles
- Add speech-bubble text to the police-uniform illustration in section 1 using actual drama quotes
Reference images
How to use this AI Image prompt template
 1
1Copy the prompt — grab this template’s prompt and negative prompt.  2
2Pick a model — choose a recommended AI model for the best match.  3
3Generate — open the studio with one click and create your result.
Related templates

Infographic Explaining Fibonacci Sequence with Math and Code
Create a cinematic image of Infographic Explaining Fibonacci Sequence With Math And Code. Style: photorealistic. Composition: balanced and well-framed. Lighting: natural with cinematic mood. Category: cinematic-video. Reference: infographic-explaining-fibonacci-sequence-with-math-and-code-1867.

Premium Pitch Deck Storyboard
Create a game image of Premium Pitch Deck Storyboard. Style: photorealistic. Composition: balanced and well-framed. Lighting: natural with cinematic mood. Category: illustration. Reference: premium-pitch-deck-storyboard-25540.

Dense vs MoE Neural Network Infographic
{ "type": "infographic comparison diagram", "header": { "title": "{argument name=\"main title\" default=\"Dense と MoE の違い\"}" }, "layout": { "structure": "two main columns separated by a central VS badge, with a split footer at the bottom", "sections": [ { "position": "left column", "theme_color": "blue", "header": "{argument name=\"left model name\" default=\"Dense モデル\"}", "subtitle": "全てのニューロンが活性化", "diagram": { "type": "fully connected neural network", "elements": [ "1 orange input node labeled 入力", "4 hidden layers with 4, 5, 4, and 2 nodes respectively", "nodes colored white, blue, and yellow", "dense intersecting connection lines between all adjacent nodes" ] }, "bullet_points": { "count": 2, "items": [ "{argument name=\"left bullet point\" default=\"全てのパラメータが使用\"}", "計算コストが高い" ] } }, { "position": "right column", "theme_color": "orange", "header": "{argument name=\"right model name\" default=\"MoE モデル\"}", "subtitle": "一部の専門家が選択的に活性化", "diagram": { "type": "mixture of experts network", "elements": [ "1 orange input node labeled 入力", "3 rectangular blocks labeled Expert 1, Expert 2, Expert 3", "1 yellow output node labeled 出力", "branching arrows connecting input to experts, and experts to output" ] }, "bullet_points": { "count": 2, "items": [ "{argument name=\"right bullet point\" default=\"一部のエキスパートのみ使用\"}", "効率的でスケーラブル" ] } }, { "position": "center", "element": "red circular badge with text VS", "connections": "blue arrow pointing left, orange arrow pointing right" }, { "position": "footer left", "background": "light blue", "text": "Dense: すべての層が常時稼働し全パラメータを使用", "icon": "1 CPU chip graphic", "label": "高い消費電力" }, { "position": "footer right", "background": "light orange", "text": "MoE: 必要なエキスパートのみを動員", "icons": "2 circular graphics (orange arrows, blue lightning bolt)", "label": "低コスト・高効率" } ] } }3b:Ta7a,{ "type": "infographic comparison diagram", "header": { "title": "{argument name=\"main title\" default=\"Dense と MoE の違い\"}" }, "layout": { "structure": "two main columns separated by a central VS badge, with a split footer at the bottom",

Encyclopedia Style Infographic Generator
Create a infographic image of Encyclopedia Style Infographic Generator. Style: photorealistic. Composition: balanced and well-framed. Lighting: natural with cinematic mood. Category: illustration. Reference: encyclopedia-style-infographic-generator-14129.

Infographic Creation with Simple Text Prompt
Create a infographic image of Infographic Creation With Simple Text Prompt. Style: photorealistic. Composition: balanced and well-framed. Lighting: natural with cinematic mood. Category: illustration. Reference: infographic-creation-with-simple-text-prompt-11083.

Dopamine and schizophrenia synapse diagram
Create a creative image of Dopamine And Schizophrenia Synapse Diagram. Style: photorealistic. Composition: balanced and well-framed. Lighting: natural with cinematic mood. Category: photography. Reference: dopamine-and-schizophrenia-synapse-diagram-255.
Explore more prompts
Browse more AI image and video prompts by category.
FAQ
- What do the overlapping circles in section 1 specifically label?
- They show the intersection of 反腐敗 and 掃黒除悪 campaigns central to the drama's political context.
- Which three city stages appear in the section 3 timeline?
- 1998 village, 2006 factories, and 2020 modern high-rise city reflecting rapid GDP expansion.