文生图
LLM Architecture Chat Screenshot — AI 图像提示词
Creates a realistic AI chat screenshot featuring a dense blue-and-white technical infographic explaining how large language models work. - AIPinMaker
提示词
Goal: Create a realistic screenshot of an AI chat interface showing a generated technical infographic about {argument name="topic" default="how Large Language Models (LLMs) work technically"}. The screenshot should look like a modern web app conversation, not a standalone poster.
Canvas: 768×1024 vertical screenshot, light gray app background, rounded white content areas, clean sans-serif typography, subtle shadows, high-resolution but with the infographic text slightly small like a real embedded generated image.
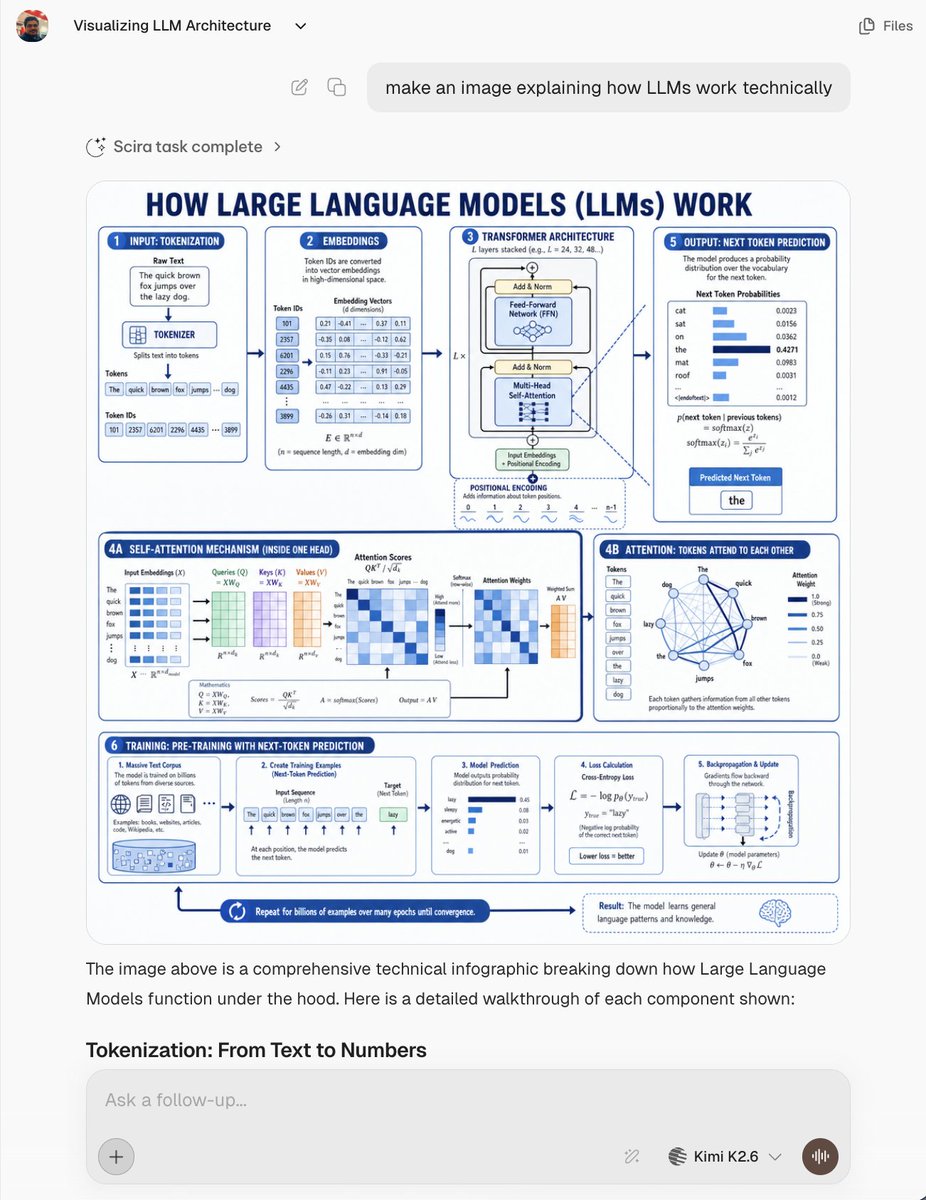
Chat UI layout: At the top left show a small circular user avatar, the chat title “Visualizing LLM Architecture” with a tiny dropdown chevron, and at the top right a simple “Files” label with an icon. Below, show a rounded user message bubble aligned near the top center/right containing: “make an image explaining how LLMs work technically”. Under it, show a small status row reading “Scira task complete” with a sparkle/loader icon and chevron. The main generated image appears below as a large rounded rectangle card. Beneath the image, include assistant explanatory text: “The image above is a comprehensive technical infographic breaking down how Large Language Models function under the hood. Here is a detailed walkthrough of each component shown:” followed by the bold section heading “Tokenization: From Text to Numbers”. At the bottom, show a rounded input box with placeholder “Ask a follow-up...”, a plus button on the left, small tool/model controls on the right, the model label “Kimi K2.6” with a dropdown, and a circular voice button.
Generated infographic inside the chat: Design a blue-and-white technical educational poster titled in large navy caps: “HOW LARGE LANGUAGE MODELS (LLMs) WORK”. Use a white background, navy-blue outlines, light-blue highlights, rounded panels, arrows connecting steps, miniature charts, equations, tables, and icons. The poster should be information-dense and engineering-oriented.
Infographic sections: Use exactly 8 labeled panels/areas:
1. “INPUT: TOKENIZATION” panel showing a raw text box with the sentence “The quick brown fox jumps over the lazy dog.”, a tokenizer block, token boxes for the words, and token ID boxes.
2. “EMBEDDINGS” panel showing token IDs converted into dense vectors, with a small table of numeric embedding values.
3. “TRANSFORMER ARCHITECTURE” panel showing a stacked transformer block with Add & Norm, Feed-Forward Network, Multi-Head Self-Attention, input embeddings, positional encoding, and layer repetition notation.
4A. “SELF-ATTENTION MECHANISM (INSIDE ONE HEAD)” wide lower-left panel showing matrices for input embeddings, queries, keys, values, attention scores, softmax, attention weights, weighted sum, and equations.
4B. “ATTENTION: TOKENS ATTEND TO EACH OTHER” panel showing a network graph of tokens from the example sentence connected by blue lines plus attention-weight bars.
5. “OUTPUT: NEXT TOKEN PREDICTION” panel showing probability distribution bars for candidate next tokens such as cat, sat, on, the, mat, roof, then highlighting the predicted next token “the”.
6. “TRAINING: PRE-TRAINING WITH NEXT-TOKEN PREDICTION” long bottom strip divided into 5 mini-cards: massive text corpus, creating training examples, model prediction, loss calculation, and backpropagation/update.
7. Bottom process arrow reading “Repeat for billions of examples over many epochs until convergence.”
8. Bottom-right result callout with a brain icon explaining that the model learns general language patterns and knowledge.
Visual style: Crisp vector infographic, academic but friendly, dark navy headings, medium-blue borders, pale-blue fills, tiny tables and plots, clean arrows, rounded cards, consistent spacing. Make the embedded infographic resemble an AI-generated educational diagram with dense but mostly legible small text.
Constraints: Keep all UI text in English. Do not add watermarks. Preserve the visible chat screenshot framing and the large embedded infographic. Use exactly the listed 8 infographic areas and exactly 5 mini-cards inside the training strip.39:T103c,Goal: Create a realistic screenshot of an AI chat interface showing参考图片

如何使用这个 AI 图像提示词模板
 1
1复制提示词 —— 取走该模板的提示词与反向提示词。  2
2选择模型 —— 选一个推荐的 AI 模型以获得最佳匹配。  3
3生成 —— 一键打开工作台并生成你的作品。
相关模板

Infographic Explaining Fibonacci Sequence with Math and Code
Create a cinematic image of Infographic Explaining Fibonacci Sequence With Math And Code. Style: photorealistic. Composition: balanced and well-framed. Lighting: natural with cinematic mood. Category: cinematic-video. Reference: infographic-explaining-fibonacci-sequence-with-math-and-code-1867.

Premium Pitch Deck Storyboard
Create a game image of Premium Pitch Deck Storyboard. Style: photorealistic. Composition: balanced and well-framed. Lighting: natural with cinematic mood. Category: illustration. Reference: premium-pitch-deck-storyboard-25540.

Dense vs MoE Neural Network Infographic
{ "type": "infographic comparison diagram", "header": { "title": "{argument name=\"main title\" default=\"Dense と MoE の違い\"}" }, "layout": { "structure": "two main columns separated by a central VS badge, with a split footer at the bottom", "sections": [ { "position": "left column", "theme_color": "blue", "header": "{argument name=\"left model name\" default=\"Dense モデル\"}", "subtitle": "全てのニューロンが活性化", "diagram": { "type": "fully connected neural network", "elements": [ "1 orange input node labeled 入力", "4 hidden layers with 4, 5, 4, and 2 nodes respectively", "nodes colored white, blue, and yellow", "dense intersecting connection lines between all adjacent nodes" ] }, "bullet_points": { "count": 2, "items": [ "{argument name=\"left bullet point\" default=\"全てのパラメータが使用\"}", "計算コストが高い" ] } }, { "position": "right column", "theme_color": "orange", "header": "{argument name=\"right model name\" default=\"MoE モデル\"}", "subtitle": "一部の専門家が選択的に活性化", "diagram": { "type": "mixture of experts network", "elements": [ "1 orange input node labeled 入力", "3 rectangular blocks labeled Expert 1, Expert 2, Expert 3", "1 yellow output node labeled 出力", "branching arrows connecting input to experts, and experts to output" ] }, "bullet_points": { "count": 2, "items": [ "{argument name=\"right bullet point\" default=\"一部のエキスパートのみ使用\"}", "効率的でスケーラブル" ] } }, { "position": "center", "element": "red circular badge with text VS", "connections": "blue arrow pointing left, orange arrow pointing right" }, { "position": "footer left", "background": "light blue", "text": "Dense: すべての層が常時稼働し全パラメータを使用", "icon": "1 CPU chip graphic", "label": "高い消費電力" }, { "position": "footer right", "background": "light orange", "text": "MoE: 必要なエキスパートのみを動員", "icons": "2 circular graphics (orange arrows, blue lightning bolt)", "label": "低コスト・高効率" } ] } }3b:Ta7a,{ "type": "infographic comparison diagram", "header": { "title": "{argument name=\"main title\" default=\"Dense と MoE の違い\"}" }, "layout": { "structure": "two main columns separated by a central VS badge, with a split footer at the bottom",

Encyclopedia Style Infographic Generator
Create a infographic image of Encyclopedia Style Infographic Generator. Style: photorealistic. Composition: balanced and well-framed. Lighting: natural with cinematic mood. Category: illustration. Reference: encyclopedia-style-infographic-generator-14129.

Infographic Creation with Simple Text Prompt
Create a infographic image of Infographic Creation With Simple Text Prompt. Style: photorealistic. Composition: balanced and well-framed. Lighting: natural with cinematic mood. Category: illustration. Reference: infographic-creation-with-simple-text-prompt-11083.

Dopamine and schizophrenia synapse diagram
Create a creative image of Dopamine And Schizophrenia Synapse Diagram. Style: photorealistic. Composition: balanced and well-framed. Lighting: natural with cinematic mood. Category: photography. Reference: dopamine-and-schizophrenia-synapse-diagram-255.
探索更多提示词
按分类浏览更多 AI 图像和视频提示词。