Text to Image
Human Anatomy Educational Infographic - Nano Banana Pro AI Prompt for Infographic / Edu Visual — AI Image Prompt
A comprehensive infographic prompt for comparing the human heart and brain, featuring anatomical diagrams and summary cards in a clean illustrative style. - AIPinMaker
Prompt
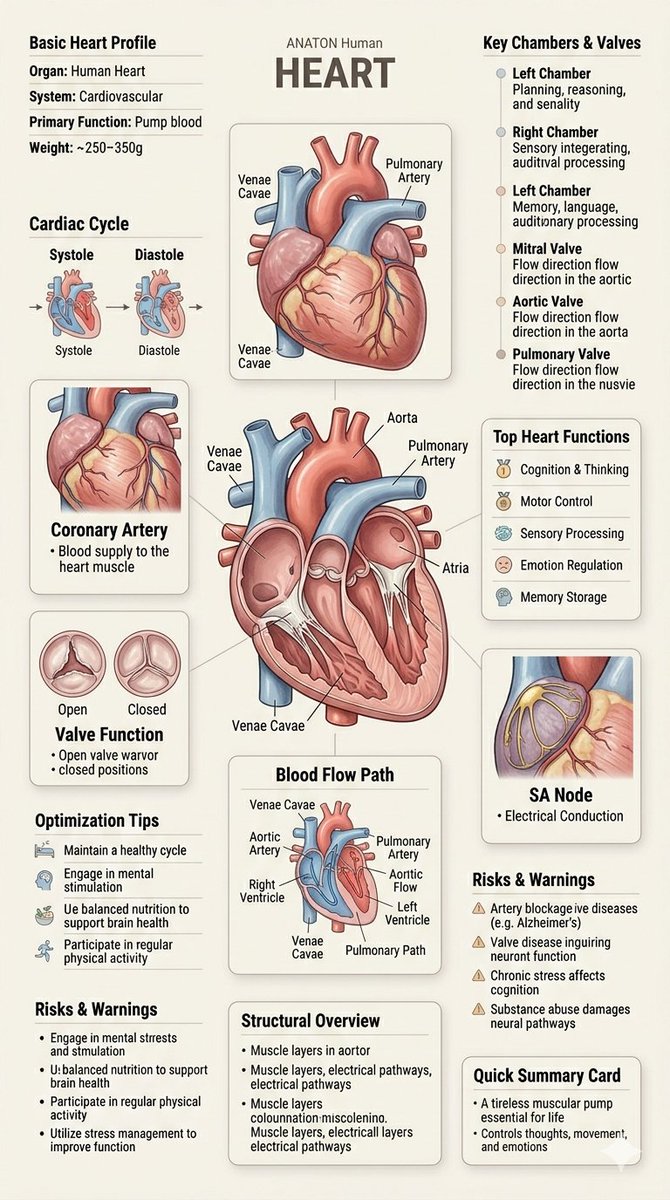
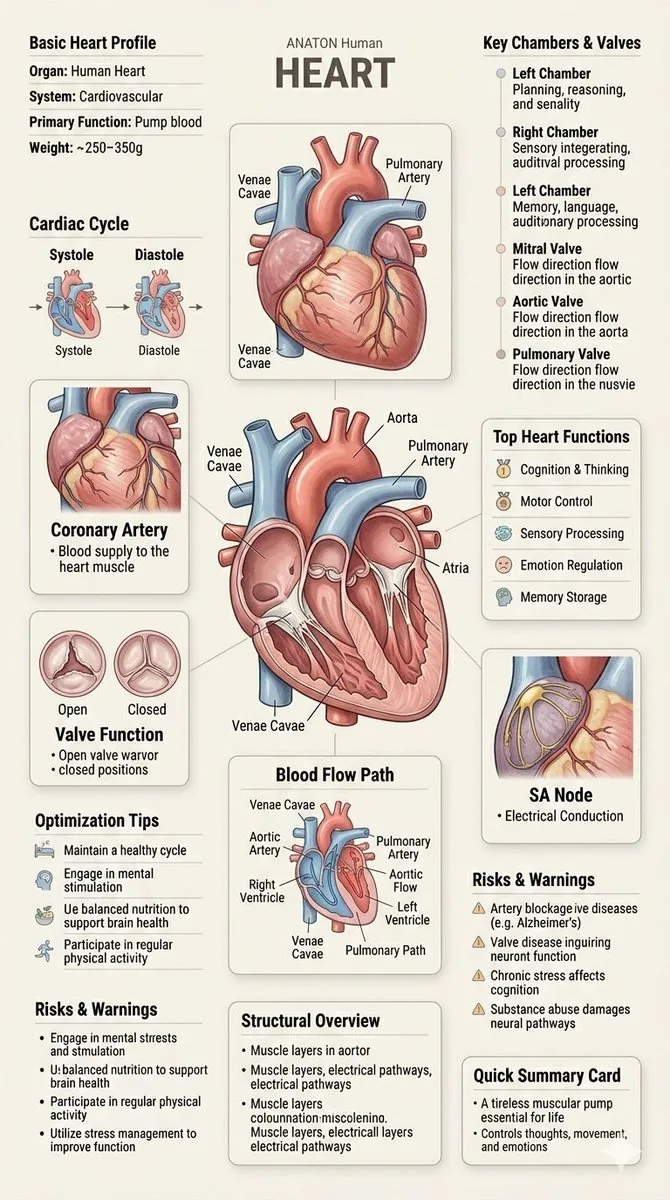
This combination infographic, based on images of the {argument name="subjects" default="human heart and brain"}, provides a comparative and complementary look at the body’s most vital organs. Following a consistent and clean illustrative style with detailed callouts and key summary cards, it presents a comprehensive "Human Anatomy: Heart and Brain" profile. The central section features a detailed internal cross-section of the heart on the left and a detailed, regionalized map of the brain (Frontal, Parietal, Temporal, and Occipital lobes) on the right. Below the heart, the "Cardiac Cycle" and "Blood Flow Path" diagrams are presented. To the left, a vertical sequence detailing the brain’s "Frontal Lobe," "Temporal Lobe," and "Cerebellum" (with descriptions of functions like memory, motor control, and reasoning) matches the structure of the cardiac information. Above the brain diagram, a revised "Key Regions & Functions" list replaces the chambers and valves, and below it, a revised "Top 5 Brain Functions" list includesCognition & Thinking, Sensory Processing, and Emotion Regulation. Both columns share common "Optimization Tips," "Risks & Warnings" (tailored to each organ's respective risks, such as cardiovascular disease vs. neurodegenerative disease), and "Quick Summary Cards," highlighting the heart as the body's pump and the brain as its control center, emphasizing their integrated nature and critical roles. The entire layout is structured to facilitate a direct side-by-side analysis, making it an exhaustive and cohesive educational tool.3a:TPrompt breakdown
- Subject
- human heart cross-section paired with brain lobe map showing Frontal, Parietal, Temporal, Occipital lobes plus Cardiac Cycle, Blood Flow Path, and function lists for memory, motor control, reasoning
- Style
- consistent clean illustrative style with detailed callouts and key summary cards
- Composition
- side-by-side columns with heart left and brain right, vertical function sequences, Key Regions & Functions list above brain, Top 5 Brain Functions list below, plus shared tips and summary cards
Remix ideas
- swap cerebellum for hypothalamus while keeping the same vertical layout
- add miniature ECG waveform icons next to the Cardiac Cycle diagram
- change the Top 5 Brain Functions list to include language processing and spatial navigation
Reference images
How to use this AI Image prompt template
 1
1Copy the prompt — grab this template’s prompt and negative prompt.  2
2Pick a model — choose a recommended AI model for the best match.  3
3Generate — open the studio with one click and create your result.
Related templates

Museum Style Infographic Breakdown
Create a infographic image of Museum Style Infographic Breakdown. Style: photorealistic. Composition: balanced and well-framed. Lighting: natural with cinematic mood. Category: illustration. Reference: museum-style-infographic-breakdown-13977.

Hilbert Curve Infographic
{ "type": "educational mathematical infographic", "header": { "title": "{argument name=\"main title\" default=\"Hilbert Curve\"}", "subtitle": "{argument name=\"degree subtitle\" default=\"Degree 3 (Order 3)\"}", "equation": "n = 3 -> 2^n x 2^n = 8 x 8 grid, 2^(2n) = 64 steps" }, "layout": { "left_panel": "large 2D line plot", "right_sidebar": "stacked informational panels and text blocks" }, "main_graph": { "axes": { "x_axis": "labeled 'x (column index)' with ticks 0 to 7", "y_axis": "labeled 'y (row index)' with ticks 0 to 7" }, "grid": "{argument name=\"grid size\" default=\"8x8\"} dashed light gray lines", "curve": { "description": "continuous non-intersecting path filling the grid", "style": "thick line with directional arrows", "colors": "{argument name=\"curve colors\" default=\"gradient transitioning through purple, blue, green, yellow, orange, and red\"}", "markers": [ "purple dot at bottom left labeled '00'", "blue dot at top left labeled '64'" ], "labels": "various two-digit numbers scattered along the path vertices, such as 01, 02, 32, 65, 70" } }, "sidebar": { "sections": [ { "title": "Legend", "type": "box with rounded corners", "count": 4, "items": [ "purple dot: 'Start (step 0)'", "blue dot: 'End (step 63)'", "black arrow: 'Direction of traversal'", "colored lines: 'Curve (colored by sub-quadrant progression)'" ] }, { "title": "Definition", "type": "text block", "text": "Hilbert curve of degree n maps the unit interval [0,1] onto the unit square [0,1]x[0,1] while preserving locality." }, { "title": "Properties", "type": "bulleted list", "heading": "For degree 3:", "count": 3, "items": [ "Grid size: 8 x 8 = 2^3 x 2^3", "Total steps: 64 = 2^{2*3}", "Visits each of the 64 grid points exactly once in a continuous path." ] }, { "title": "Quadrant structure (recursive)", "type": "2x2 colored grid", "count": 4, "boxes": [ "Top-left blue: 'Q2 (steps 32-63)'", "Top-right yellow: 'Q3 (steps 48-63)'", "Bottom-left purple: 'Q0 (steps 0-31)'", "Bottom-right pink: 'Q1 (steps 16-47)'" ], "footer_text": "Each quadrant is a degree-2 Hilbert curve (recursively defined)." } ] } }

Vintage Chalkboard Heart Anatomy
A detailed, vintage-style chalkboard illustration explaining the anatomy of the human heart. The drawing should be done in a realistic, scientific style with white and colored chalk. All the different parts of the heart (ventricles, atriums, valves) should be clearly labeled with elegant, cursive handwriting. The texture of the chalkboard and the chalk dust should be visible, showcasing a rich, knowledge-based rendering capability. –ar 4:3

Detailed Japanese Graphic Recording Summary
Create a creative image of Detailed Japanese Graphic Recording Summary. Style: photorealistic. Composition: balanced and well-framed. Lighting: natural with cinematic mood. Category: photography. Reference: detailed-japanese-graphic-recording-summary-2736.

Technical Blueprint Infographic Style
Create a infographic image of Technical Blueprint Infographic Style. Style: photorealistic. Composition: balanced and well-framed. Lighting: natural with cinematic mood. Category: illustration. Reference: technical-blueprint-infographic-style-15239.

Hand-drawn infographic card about long-term IP building
Create a infographic image of Hand Drawn Infographic Card About Long Term Ip Building. Style: photorealistic. Composition: balanced and well-framed. Lighting: natural with cinematic mood. Category: illustration. Reference: hand-drawn-infographic-card-about-long-term-ip-building-554.
Explore more prompts
Browse more AI image and video prompts by category.
FAQ
- Which brain regions receive dedicated function descriptions?
- The vertical sequence covers Frontal Lobe, Temporal Lobe, and Cerebellum with notes on memory, motor control, and reasoning.
- How are organ-specific risks displayed?
- Risks & Warnings appear in matching sections that list cardiovascular disease for the heart and neurodegenerative disease for the brain.