텍스트 투 이미지
Tattoo Artist Storyboard Infographic — AI 이미지 프롬프트
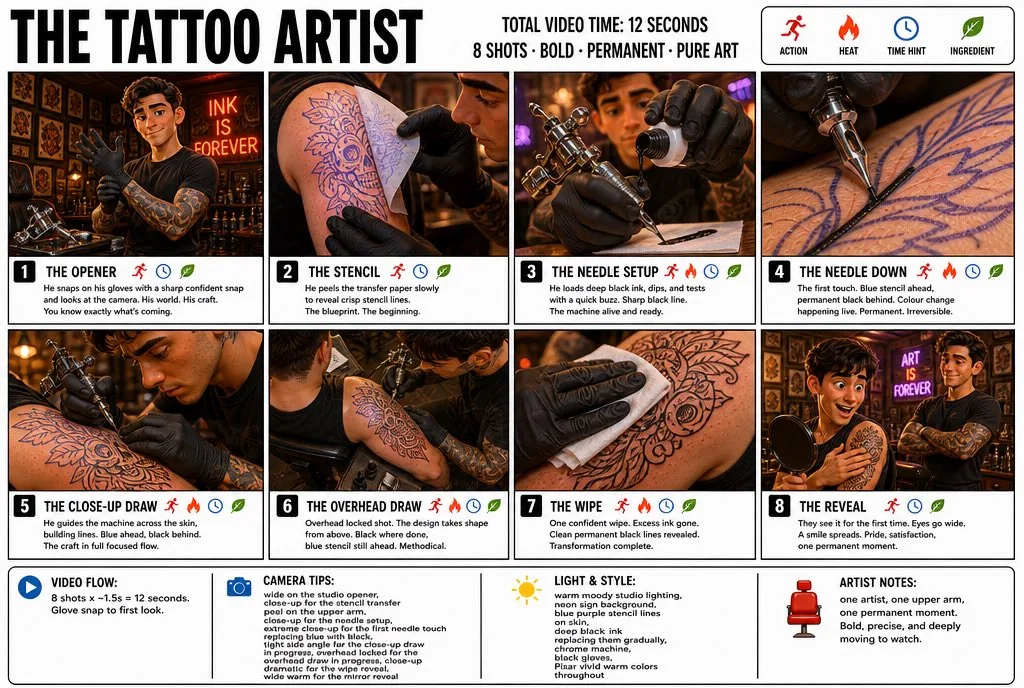
A creative storyboard prompt for generating a clean, 3D infographic poster themed around a tattoo artist using a bold, Pixar-inspired style. - AIPinMaker

프롬프트
Create a game image of Tattoo Artist Storyboard Infographic. Style: photorealistic. Composition: balanced and well-framed. Lighting: natural with cinematic mood. Category: illustration. Reference: tattoo-artist-storyboard-infographic-25946.
참고 이미지
이 AI 이미지 프롬프트 템플릿 사용 방법
 1
1프롬프트 복사 — 템플릿의 프롬프트와 네거티브 프롬프트를 가져오세요.  2
2모델 선택 — 가장 잘 맞는 추천 AI 모델을 고르세요.  3
3생성 — 클릭 한 번으로 스튜디오를 열어 결과를 만드세요.
관련 템플릿

Exploded View Invention Infographic
2x2 grid, do this for tesla coil (invention) and 3 other famous inventions. 16:9 inventor_content = ( patent_drawing_recreation_in_isometric_exploded_view_of_[invention (invention placeholder)]_by_[inventor (inventor placeholder)] * 1.7 ) + ( historical_context_timeline_of_scientific_breakthroughs_leading_to_[invention] * 1.5 ) + ( failure_log_and_iteration_cards_showing_[inventor]_s_failed_prototypes_with_annotations * 1.6 ) + ( cross_section_and_mechanics_diagram_of_[invention]_with_material_callouts * 1.4 ) + ( economic_and_cultural_impact_ripple_map_of_[invention]_on_society * 1.3 ) + ( quirky_personal_habit_or_workshop_inserts_from_[inventor]_s_biography * 1.2 ) + ( modern_day_derivative_technologies_tree_from_[invention] * 1.1 ) + ( common_misconception_busting_panel_about_who_really_invented_[invention] * 1.0 ) - ( romanticized_lone_genius_cliché_without_team_context / 3.0 ) - ( boring_textbook_engraving_style_instead_of_dynamic_infographic / 2.9 ) - ( eurocentric_filter_if_invention_originated_elsewhere / 3.2 )3

3D Cutaway Volcano Diagram
A 3D cutaway diagram of a volcano, showing its internal structure. The diagram should clearly label the magma chamber, conduit, throat, crater, and layers of ash and lava. The style should be a clean, technical illustration, with realistic textures for the rock and magma. This demonstrates the ability to generate accurate, science-based visuals for educational purposes, requiring strong spatial and scientific reasoning. –ar 16:9

Philosophical Infographic Machine Generator
2x2 grid, 16:9, do this for 4 famous philosophies: class Philosophical_Idea_Machine_DNA: def __init__(self): self.subject = "[PHILOSOPHY / CONCEPT / PARADOX] (subject)" self.parents = { "composition_parent": "Renaissance memory theatre — wheels within wheels, concentric knowledge rings, symbolic emblems", "atmosphere_parent": "Alchemical manuscript — cryptic imagery, lunar light, sepia and oxidized copper tones", "graphic_parent": "Bauhaus conceptualism — elemental shapes as thought-forms, clean lines, primary colour logic", "detail_parent": "Encyclopédie plate — mechanical cross-sections of ideas, gears of dialectic, part numbering" } self.mutations = { "medium_mutation": "Printed layers of translucent vellum overlays that build the idea when viewed together", "information_mutation": "Logical syllogisms as circuit diagrams, historical proponents as constellation maps, glossary of terms", "semantic_mutation": "The abstract idea becomes a physical, inhabitable clockwork universe", "scale_mutation": "A single logical step unfolds into a complete microcosmic city where the idea is lived reality" } self. style_mix = { "composition_parent": 0.25, "atmosphere_parent": 0.20, "graphic_parent": 0.30, "detail_parent": 0.15, "mutations": 0.10 } def generate_subject(self): subject = """ Create a vertical luxury infographic poster that gives physical form to [SUBJECT]. Invent a magnificent symbolic machine, diagram, or architecture that represents the idea. Explode its layers to show internal logic, historical influences, counterarguments, and real-world manifestations. The design must feel like a transmission from a library that exists outside time. Semantic inference should render the intangible tangible with intellectual rigour. """ return render( subject, style_mix=self. style_mix, format="vertical poster, conceptual infographic", typography=""" Large title: [CONCEPT NAME] (concept name) Subtitle: [ORIGIN / PHILOSOPHER / MAXIM] Microtext: [LOGICAL FORMULA / CITATION / FIRST USE DATE / LATIN TERM] """, composition=""" Mandala-like symmetry or dynamic tension depending on concept nature. Clear visual hierarchy, meditative spacing. """, lighting=""" Illumination from unseen source — like a page from a sacred text held to candlelight. """, constraints=""" No trite symbols (lightbulbs for ideas, etc.). No pseudo-profound emptiness. """ )3a:Tb97,2x2

Technical Infographic Prompt Template - Nano Banana Pro AI Prompt for Infographic / Edu Visual
Create a technical infographic of OBJECT (object) with a 45-degree isometric 3D perspective showing the device slightly tilted to reveal depth and dimension. Combine a realistic photoreal render with black ink technical annotations on pure white background. Include: Key component labels with color-coded callout boxes Internal component visibility through transparent/cutaway sections Measurements, dimensions, and precise scale markers Material callouts and quantities Color-coded arrows for function/flow: RED (power/battery), BLUE (data/connectivity), ORANGE (thermal/processor), GREEN (sensors/haptics) Simple schematics or cross-sectional diagrams where relevant Place “OBJECT” title in a hand-drawn technical box (top-left corner). Style: Black linework (technical pen/architectural), sketched but precise. Object remains clearly visible. Educational museum-exhibit vibe. Clean composition, balanced negative space. Perspective: Isometric 3D angle—tilted to show depth, dimension, and internal architecture dramatically. Like a professional product teardown or engineering manual. Colors: ~10-15% accent density. Black dominant. White background. Output: 1080×1080, ultra-crisp, social-feed optimized.3e:T4da

Camera Imaging Technology Infographic
Create a infographic image of Camera Imaging Technology Infographic. Style: photorealistic. Composition: balanced and well-framed. Lighting: natural with cinematic mood. Category: illustration. Reference: camera-imaging-technology-infographic-14344.

3D Printer Works Diagram
A clear and simple diagram explaining how a 3D printer works (FDM technology). The diagram should show the filament being fed into the extruder, the heating element, and the nozzle depositing the material layer by layer to build an object. The style should be a clean, 3D-esque illustration with arrows showing the process flow, demonstrating the ability to explain complex technology simply. –ar 16:9
더 많은 프롬프트 탐색
카테고리별 AI 이미지·영상 프롬프트를 더 찾아보세요.