テキストから画像
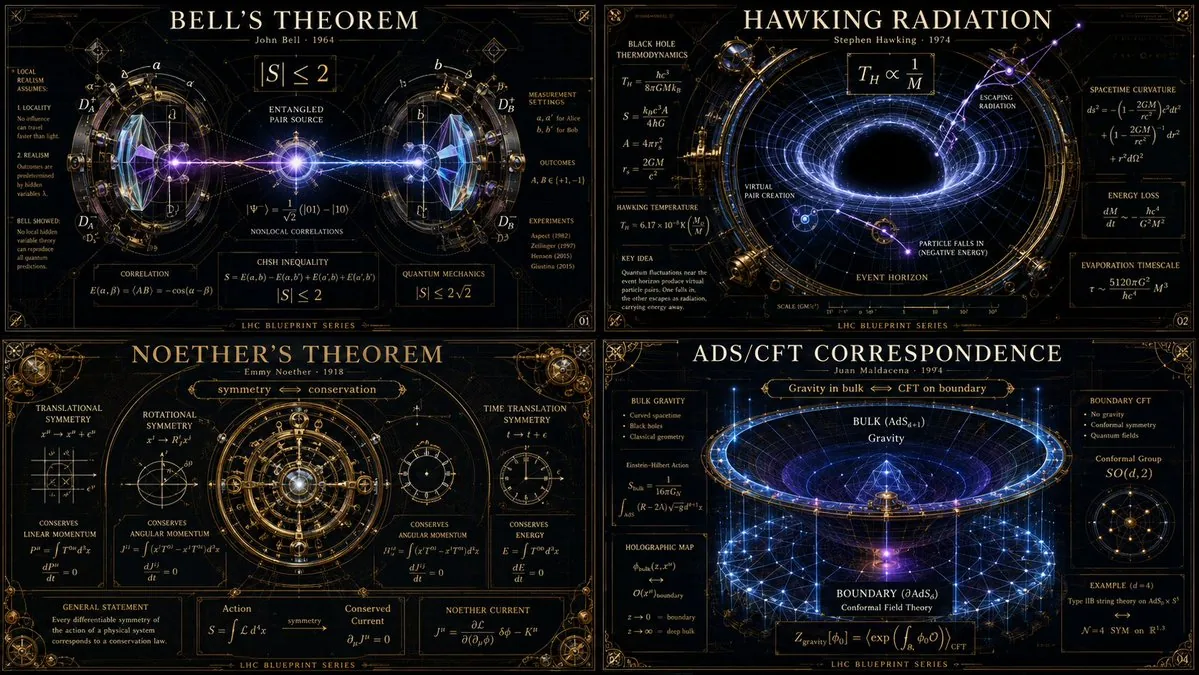
Advanced Physics Paradox Infographic — AI 画像プロンプト
A luxury vertical infographic grid visualizing advanced physics theorems like Bell's theorem or Hawking radiation with a museum-grade scientific aesthetic. - AIPinMaker

プロンプト
16:9 -> class theoretical_physics_infographic_dna: def __init__(self): self.subject = "[{argument name="topics" default="4 distinct advanced physics theorems or paradoxes (e.g., bell's theorem, hawking radiation, string theory)"}]" self.parents = { "composition_parent": "large hadron collider blueprints — hyper-complex radial symmetry, intersecting particle beam rings, millimeter-precise drafting", "atmosphere_parent": "deep space observatory photography — pitch black voids, glowing ultraviolet radiation, high-contrast laser illumination", "graphic_parent": "chalkboard maximalism — elegant, dense mathematical notation floating as glowing white vectors", "detail_parent": "victorian brass optical instruments — finely milled prisms, glass lenses, and mirrored refraction planes" } self.mutations = { "medium_mutation": "the mathematical formulas solidify into glowing, three-dimensional glass sculptures bending the light around them", "information_mutation": "particle collision tracks are woven like fine gold thread through the dark background", "semantic_mutation": "the invisible physical law is rendered as a massive, tangible, gravitational machine distorting the grid of the poster itself" } def generate_grid(self): instruction = """ generate a 2x2 grid of vertical luxury infographic posters giving physical form to the chosen [subject]s. invent a magnificent scientific machine or optical diorama for each. explode the layers to show quantum states, gravitational warping, equations, and subatomic scale. the design must feel like a classified schematic from a hyper-advanced, aesthetically obsessed civilization. semantic inference must make the invisible laws of physics breathtakingly visible. """ return render( instruction, format="2x2 grid, vertical luxury posters, conceptual scientific infographic", typography=""" large title: [name of theorem/paradox] subtitle: [the physicist / the era] microtext: [the core equation / metric tensor / explanatory blazon] """, composition="strict radial or gravitational-well symmetry. razor-sharp fine lines contrasting with deep voids.", lighting="harsh, clinical laser light interacting with pure optical glass and vantablack.", constraints="no cartoon atoms, no clip-art planets, no messy chalkboards. only pristine, museum-grade scientific aesthetic." )3c:T918,参照画像
このAI画像プロンプトテンプレートの使い方
 1
1プロンプトをコピー — テンプレートのプロンプトとネガティブプロンプトを取得。  2
2モデルを選ぶ — 最適な推奨AIモデルを選択。  3
3生成 — ワンクリックでスタジオを開いて作成。
関連テンプレート

Technical Breakdown Infographic
Create a infographic image of Technical Breakdown Infographic. Style: photorealistic. Composition: balanced and well-framed. Lighting: natural with cinematic mood. Category: illustration. Reference: technical-breakdown-infographic-24451.

Infographic Explaining Fibonacci Sequence with Math and Code
Create a cinematic image of Infographic Explaining Fibonacci Sequence With Math And Code. Style: photorealistic. Composition: balanced and well-framed. Lighting: natural with cinematic mood. Category: cinematic-video. Reference: infographic-explaining-fibonacci-sequence-with-math-and-code-1867.

Premium Pitch Deck Storyboard
Create a game image of Premium Pitch Deck Storyboard. Style: photorealistic. Composition: balanced and well-framed. Lighting: natural with cinematic mood. Category: illustration. Reference: premium-pitch-deck-storyboard-25540.

Exploded View Invention Infographic
2x2 grid, do this for tesla coil (invention) and 3 other famous inventions. 16:9 inventor_content = ( patent_drawing_recreation_in_isometric_exploded_view_of_[invention (invention placeholder)]_by_[inventor (inventor placeholder)] * 1.7 ) + ( historical_context_timeline_of_scientific_breakthroughs_leading_to_[invention] * 1.5 ) + ( failure_log_and_iteration_cards_showing_[inventor]_s_failed_prototypes_with_annotations * 1.6 ) + ( cross_section_and_mechanics_diagram_of_[invention]_with_material_callouts * 1.4 ) + ( economic_and_cultural_impact_ripple_map_of_[invention]_on_society * 1.3 ) + ( quirky_personal_habit_or_workshop_inserts_from_[inventor]_s_biography * 1.2 ) + ( modern_day_derivative_technologies_tree_from_[invention] * 1.1 ) + ( common_misconception_busting_panel_about_who_really_invented_[invention] * 1.0 ) - ( romanticized_lone_genius_cliché_without_team_context / 3.0 ) - ( boring_textbook_engraving_style_instead_of_dynamic_infographic / 2.9 ) - ( eurocentric_filter_if_invention_originated_elsewhere / 3.2 )3

3D Cutaway Volcano Diagram
A 3D cutaway diagram of a volcano, showing its internal structure. The diagram should clearly label the magma chamber, conduit, throat, crater, and layers of ash and lava. The style should be a clean, technical illustration, with realistic textures for the rock and magma. This demonstrates the ability to generate accurate, science-based visuals for educational purposes, requiring strong spatial and scientific reasoning. –ar 16:9

Dense vs MoE Neural Network Infographic
{ "type": "infographic comparison diagram", "header": { "title": "{argument name=\"main title\" default=\"Dense と MoE の違い\"}" }, "layout": { "structure": "two main columns separated by a central VS badge, with a split footer at the bottom", "sections": [ { "position": "left column", "theme_color": "blue", "header": "{argument name=\"left model name\" default=\"Dense モデル\"}", "subtitle": "全てのニューロンが活性化", "diagram": { "type": "fully connected neural network", "elements": [ "1 orange input node labeled 入力", "4 hidden layers with 4, 5, 4, and 2 nodes respectively", "nodes colored white, blue, and yellow", "dense intersecting connection lines between all adjacent nodes" ] }, "bullet_points": { "count": 2, "items": [ "{argument name=\"left bullet point\" default=\"全てのパラメータが使用\"}", "計算コストが高い" ] } }, { "position": "right column", "theme_color": "orange", "header": "{argument name=\"right model name\" default=\"MoE モデル\"}", "subtitle": "一部の専門家が選択的に活性化", "diagram": { "type": "mixture of experts network", "elements": [ "1 orange input node labeled 入力", "3 rectangular blocks labeled Expert 1, Expert 2, Expert 3", "1 yellow output node labeled 出力", "branching arrows connecting input to experts, and experts to output" ] }, "bullet_points": { "count": 2, "items": [ "{argument name=\"right bullet point\" default=\"一部のエキスパートのみ使用\"}", "効率的でスケーラブル" ] } }, { "position": "center", "element": "red circular badge with text VS", "connections": "blue arrow pointing left, orange arrow pointing right" }, { "position": "footer left", "background": "light blue", "text": "Dense: すべての層が常時稼働し全パラメータを使用", "icon": "1 CPU chip graphic", "label": "高い消費電力" }, { "position": "footer right", "background": "light orange", "text": "MoE: 必要なエキスパートのみを動員", "icons": "2 circular graphics (orange arrows, blue lightning bolt)", "label": "低コスト・高効率" } ] } }3b:Ta7a,{ "type": "infographic comparison diagram", "header": { "title": "{argument name=\"main title\" default=\"Dense と MoE の違い\"}" }, "layout": { "structure": "two main columns separated by a central VS badge, with a split footer at the bottom",
他のプロンプトを探す
カテゴリ別にAI画像・動画プロンプトをもっと見る。